Knowing how your animals will fare over time is an important part of being a wildlife manager. Not all animals live long lives, and sometimes thats by design. Having a long term plan for “long-lived” species such as deer, would be more beneficial than the same type of plan for a spawning cycle of fish for example. A survivorship curve can help you visualize how mortality correlates to age for different types of animals, which is what we’re discussing today.
To begin, survivorship curves are part of a Life Table. Life Tables are a systematic means of describing mortality as it affects various age groups in a population. In other words, a life table is an age-specific summary of the mortality rates operating on a population.
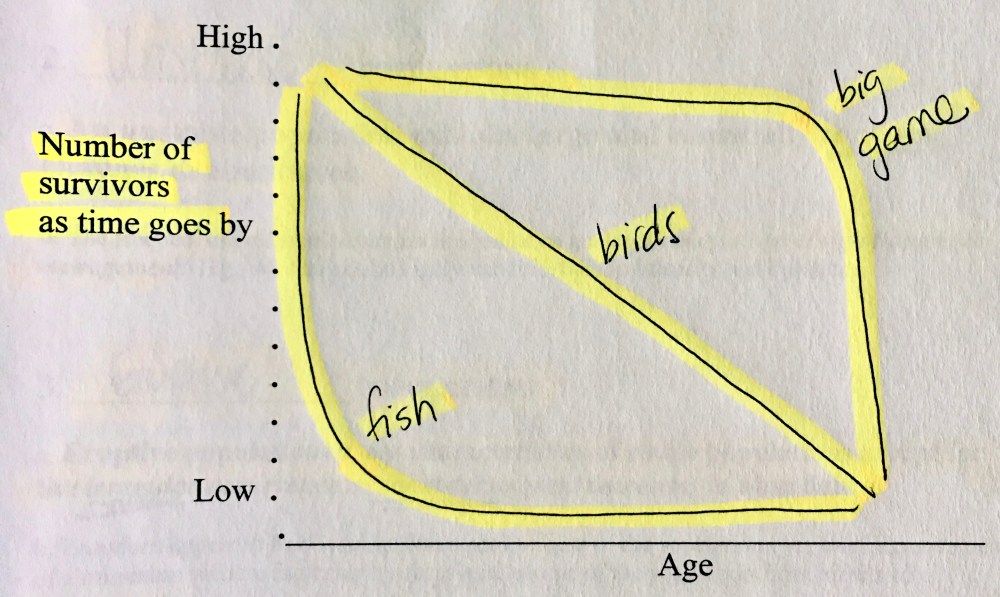
One of the most important parts of a life table is the “Ix” column, which is the number of animals alive at each age level. This data is often graphed as a Survivorship Curve. A survivorship curve is a graphical picture of how animals in a population will generally fare over time.

There are three types of Survivorship Curves – and remember, this is if the animals are NOT hunted, trapped, or taken by anglers!
- Type I: Populations with very little loss for most of the animals lifespan, and then HIGH losses of older-aged individuals.
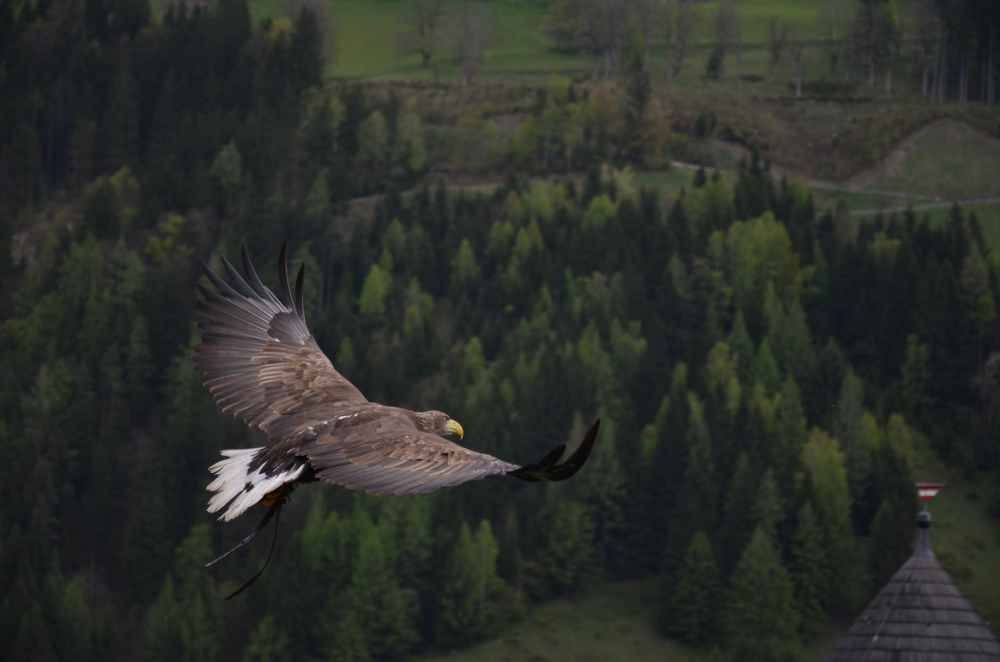
- Example: deer – the older and more mature a buck, the bigger its value to hunters
- Type II: Populations have a constant rate of mortality throughout the animals life – mortality is independent of age.
- Example: Birds
- Type III: These populations face high losses early in life followed by a period of lower and constant mortality as the animals grow older.
- Example: Fish
So how can this help you as a wildlife manager? Knowing how an animal is going to survive helps you determine the best course of action for that species. For example, if you had a large lake or pond and wanted to stock some native fish, would you add only the number you wanted to end up with? No. The rates of natural mortality are so high on fish when they’re young, you’d have to add an exponentially higher number of fry than originally planned, and only a small portion of those would be able to make it to adulthood and your population goals.
When you add in hunting, fishing, and trapping to these numbers, you can see how fine a line you have to walk in order to plan for, and maintain, a wildlife population – something a manager has to do on a daily basis.
